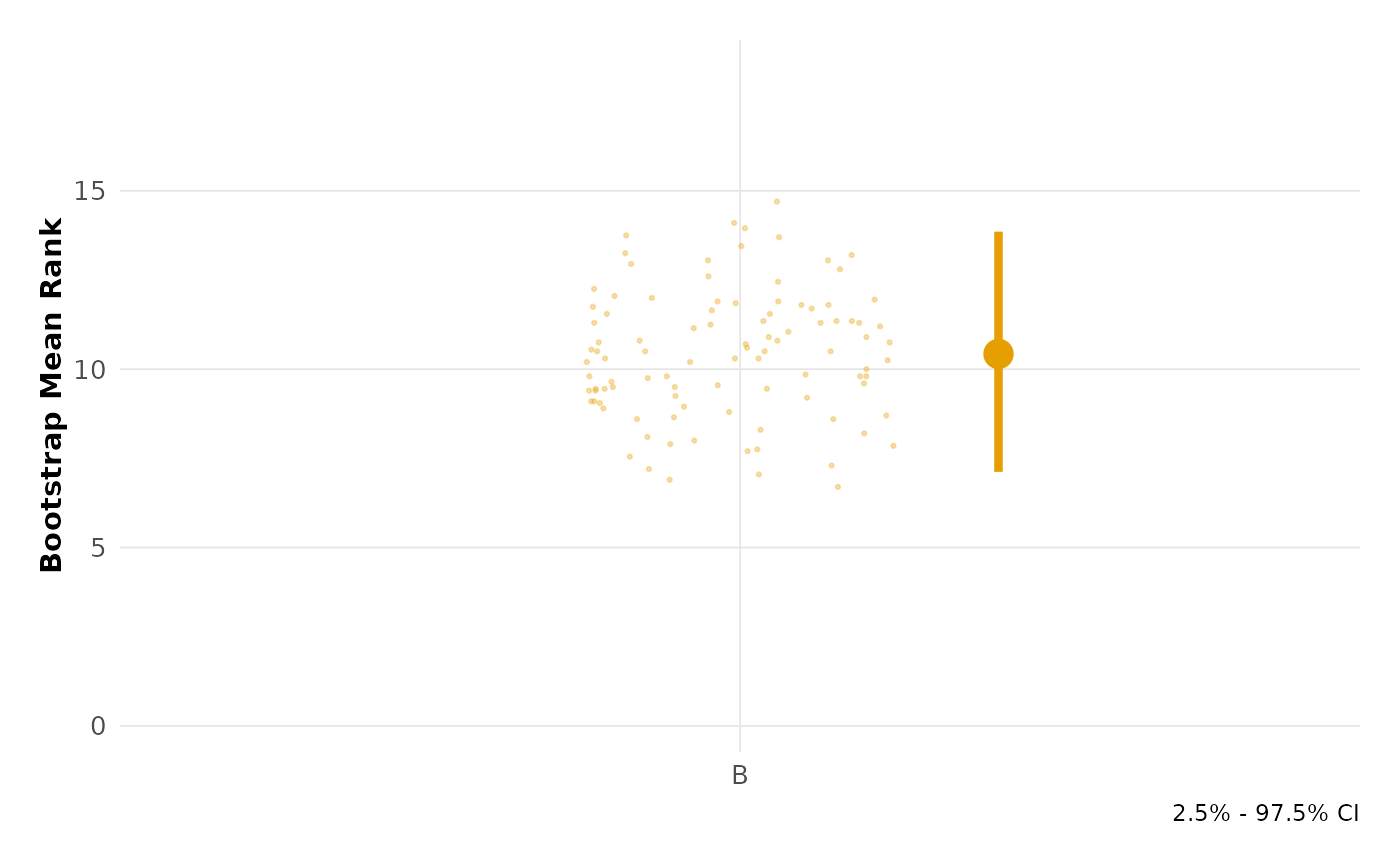
Raincloud plot showing bootstrap distributions
plot_bootstrap_raincloud.RdCreates a raincloud plot specifically for bootstrap distributions, showing the distribution of bootstrap mean ranks with jittered points and summary statistics.
Arguments
- hrest
An hrest object from
estimate- theme
the visual theme to use. Either "modern" (default) or "classic"
- colors
the color palette to use. Either "okabe_ito" (default), "default", or "viridis"
- config
an optional besthr_plot_config object