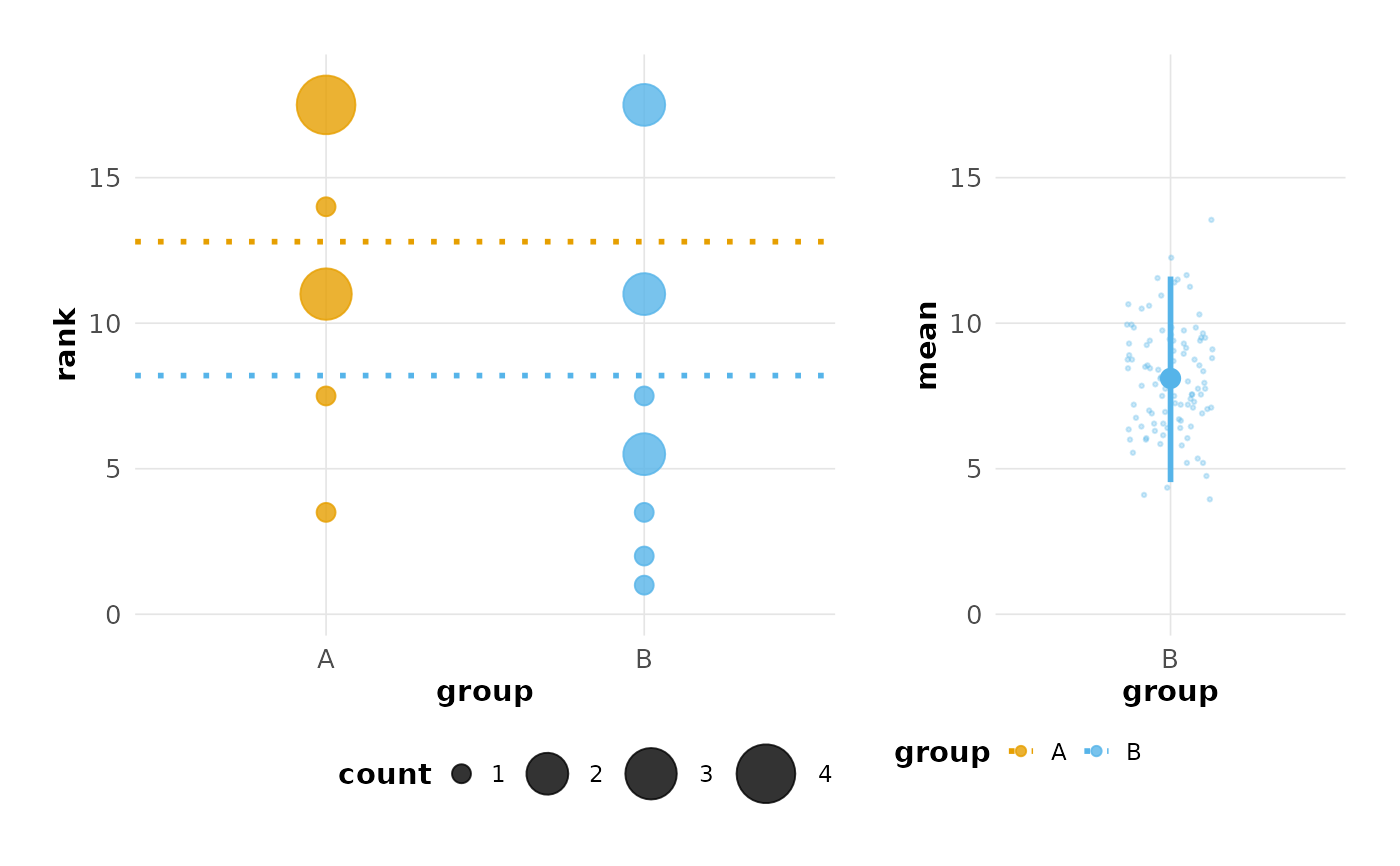
plots the hrest object
plot.hrest.Rdreturns a ggplot object representing the hrest object from
estimate. The content of left panel varies according to the
value of the which parameter. If which = "rank_simulation" is
used a plot of rank score values will be plotted in the left panel. In this
case technical replicates will be averaged if provided. If
which = "just_data" a plot of scores only is created and technical
replicates are displayed as is. In each case, the right hand panel shows the
rank bootstrap distribution and confidence interval boundaries for all non-
control groups.
Usage
# S3 method for class 'hrest'
plot(
  x,
  ...,
  which = "rank_simulation",
  theme = "modern",
  colors = "okabe_ito",
  config = NULL,
  show_significance = FALSE,
  show_effect_size = FALSE
)
Arguments
- x
the
hrestobject fromestimate- ...
Other parameters (ignored)
- which
the type of left hand panel to create. Either "rank_simulation" or "just_data"
- theme
the visual theme to use. Either "modern" (default, cleaner contemporary style) or "classic" (original besthr appearance)
- colors
the color palette to use. Either "okabe_ito" (default, colorblind-safe), "default" (original colors), or "viridis"
- config
an optional besthr_plot_config object for advanced customization. If provided, theme and colors parameters are ignored.
- show_significance
Logical, whether to show significance stars on groups where CI doesn't overlap control (default FALSE)
- show_effect_size
Logical, whether to show effect size annotation (default FALSE)
Examples
d1 <- make_data()
hr_est <- estimate(d1, score, group)
plot(hr_est)
#> Confidence interval: 2.5% - 97.5%
 # Use modern theme with colorblind-safe palette
plot(hr_est, theme = "modern", colors = "okabe_ito")
#> Confidence interval: 2.5% - 97.5%
# Use modern theme with colorblind-safe palette
plot(hr_est, theme = "modern", colors = "okabe_ito")
#> Confidence interval: 2.5% - 97.5%
 # Advanced configuration
cfg <- besthr_plot_config(
panel_widths = c(2, 1),
point_size_range = c(3, 10)
)
plot(hr_est, config = cfg)
#> Confidence interval: 2.5% - 97.5%
# Advanced configuration
cfg <- besthr_plot_config(
panel_widths = c(2, 1),
point_size_range = c(3, 10)
)
plot(hr_est, config = cfg)
#> Confidence interval: 2.5% - 97.5%