Get a preset plot style
besthr_style.RdReturns a pre-configured besthr_plot_config object with sensible
defaults for common use cases. This is the easiest way to customize
besthr plot appearance without understanding all the configuration options.
Arguments
- style
Character string specifying the style preset:
"default" - Modern theme with colorblind-safe colors (recommended)
"classic" - Original besthr appearance for backward compatibility
"publication" - Clean style suitable for journal figures
"presentation" - Larger elements for slides
"density" - Uses gradient density instead of points for bootstrap
Examples
d <- make_data()
hr <- estimate(d, score, group)
# Quick styling with presets
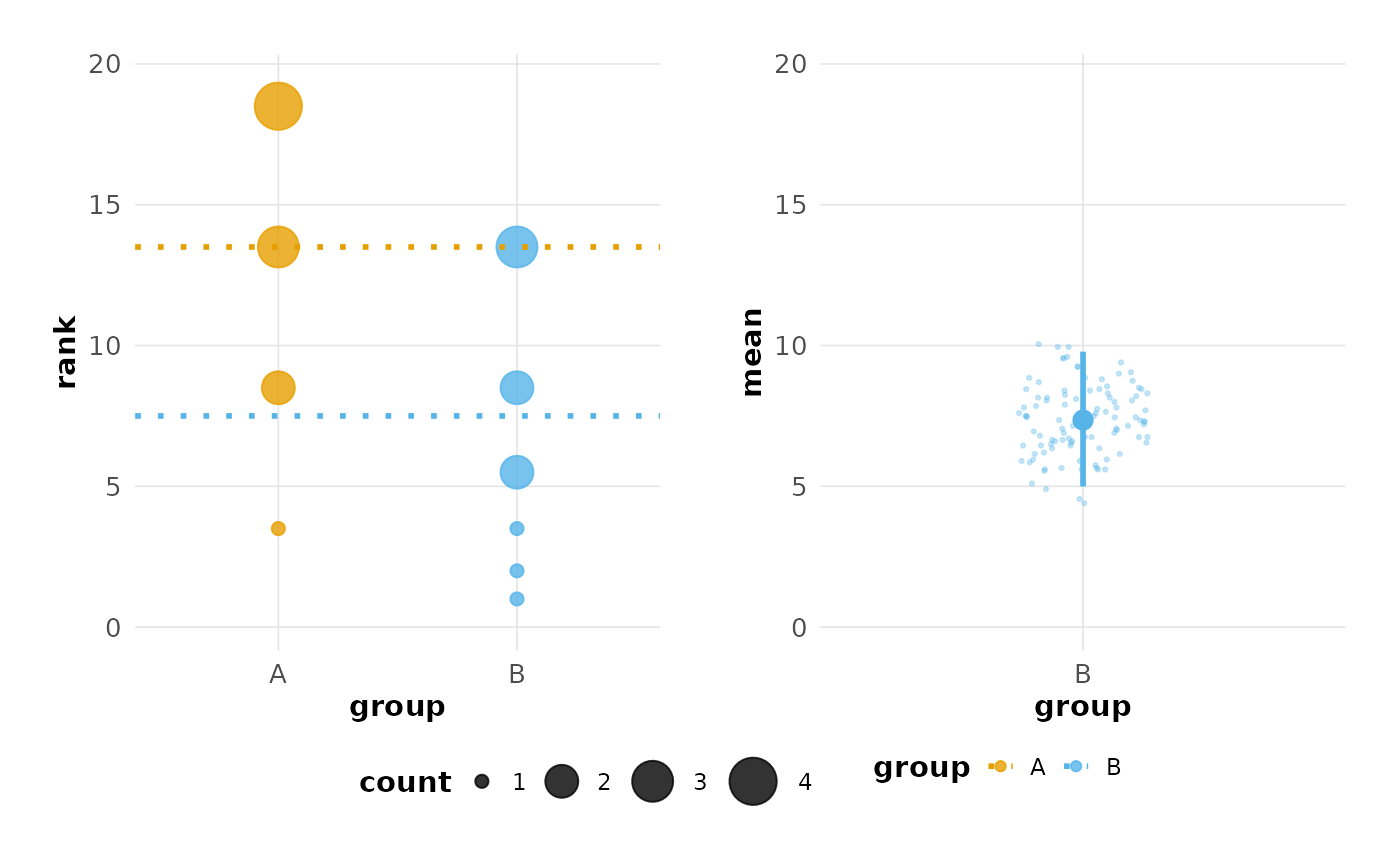
plot(hr, config = besthr_style("publication"))
#> Confidence interval: 2.5% - 97.5%
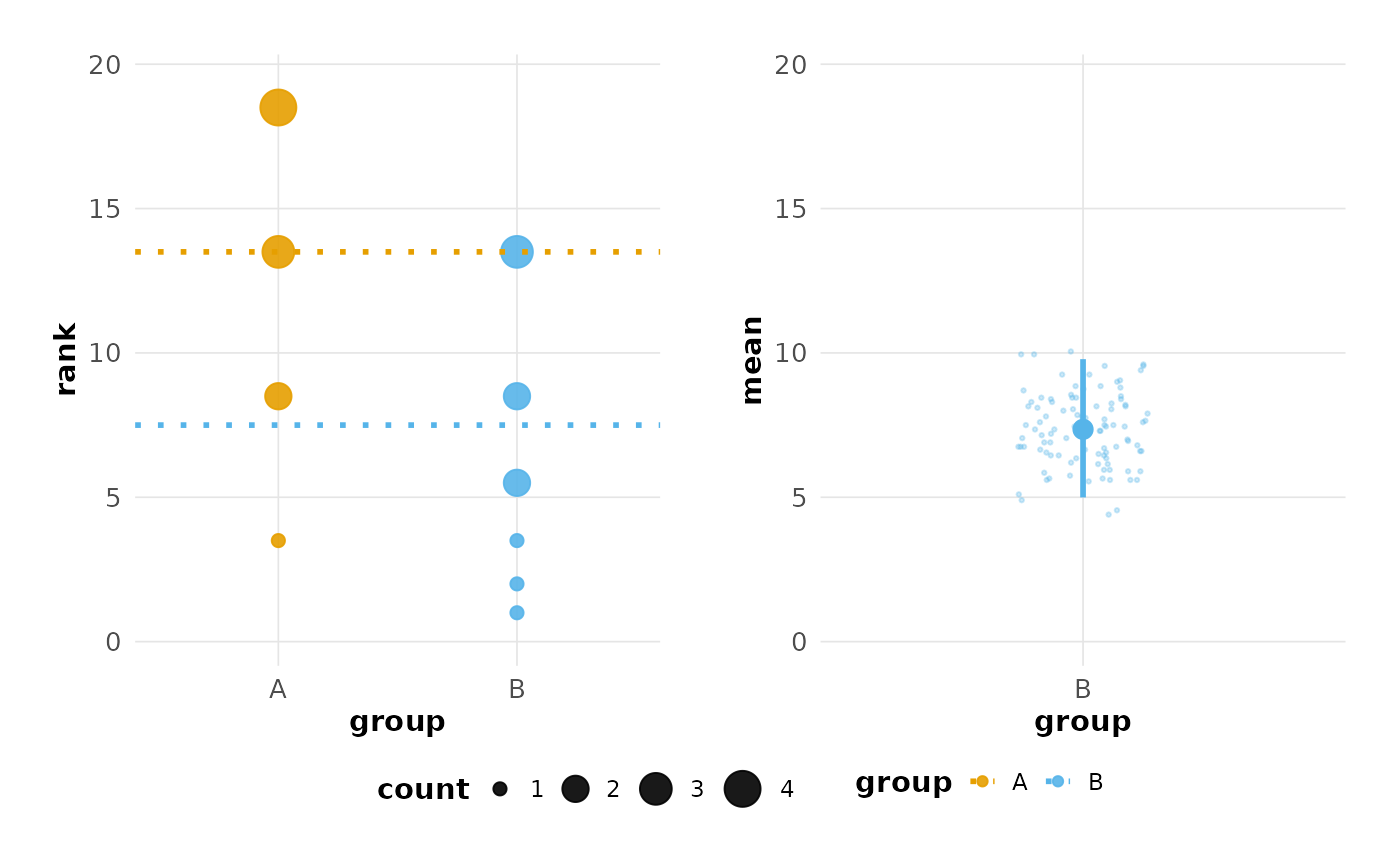 plot(hr, config = besthr_style("presentation"))
#> Confidence interval: 2.5% - 97.5%
plot(hr, config = besthr_style("presentation"))
#> Confidence interval: 2.5% - 97.5%
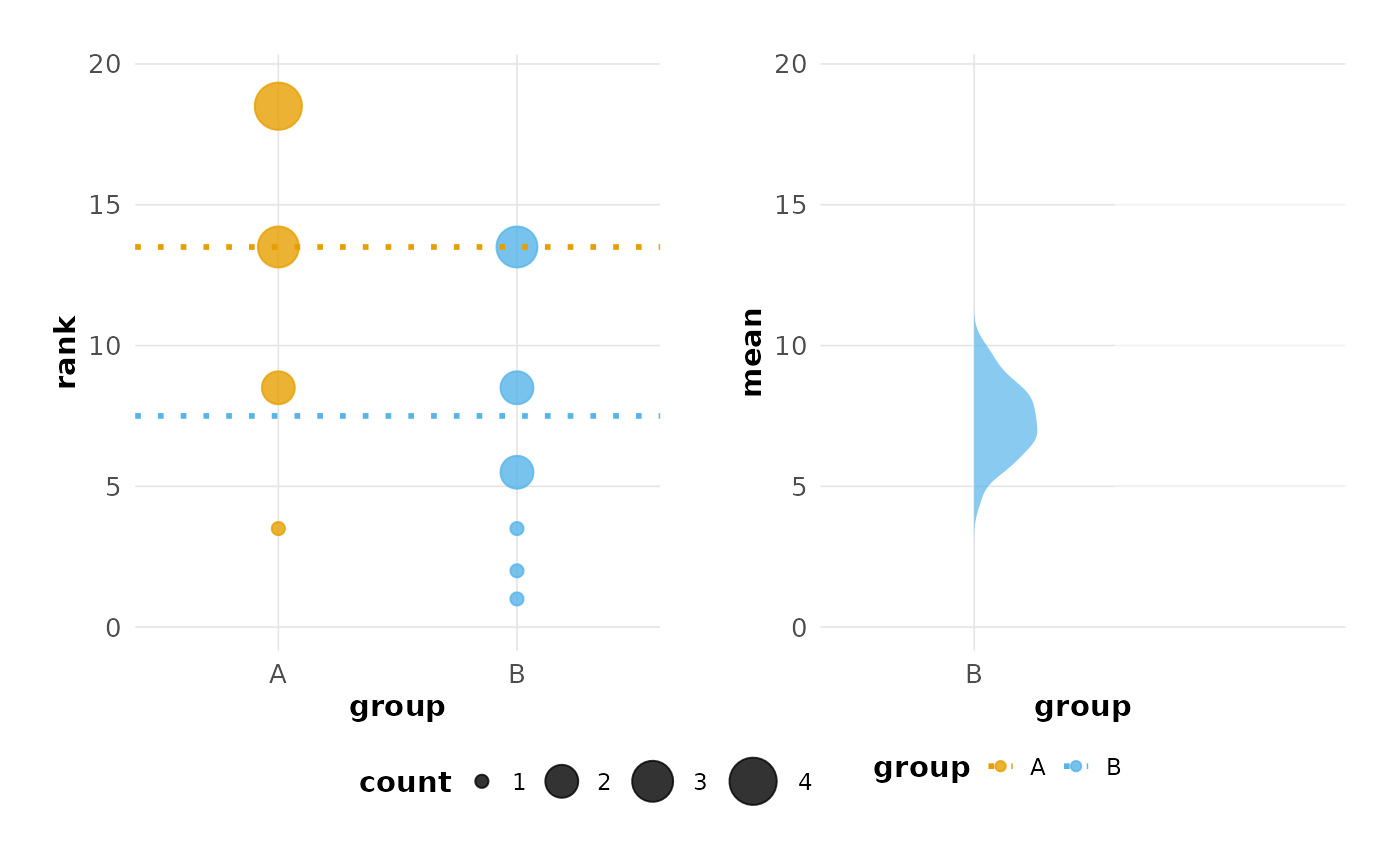
 plot(hr, config = besthr_style("density"))
#> Confidence interval: 2.5% - 97.5%
#> Picking joint bandwidth of 0.453
plot(hr, config = besthr_style("density"))
#> Confidence interval: 2.5% - 97.5%
#> Picking joint bandwidth of 0.453
 # Same as default
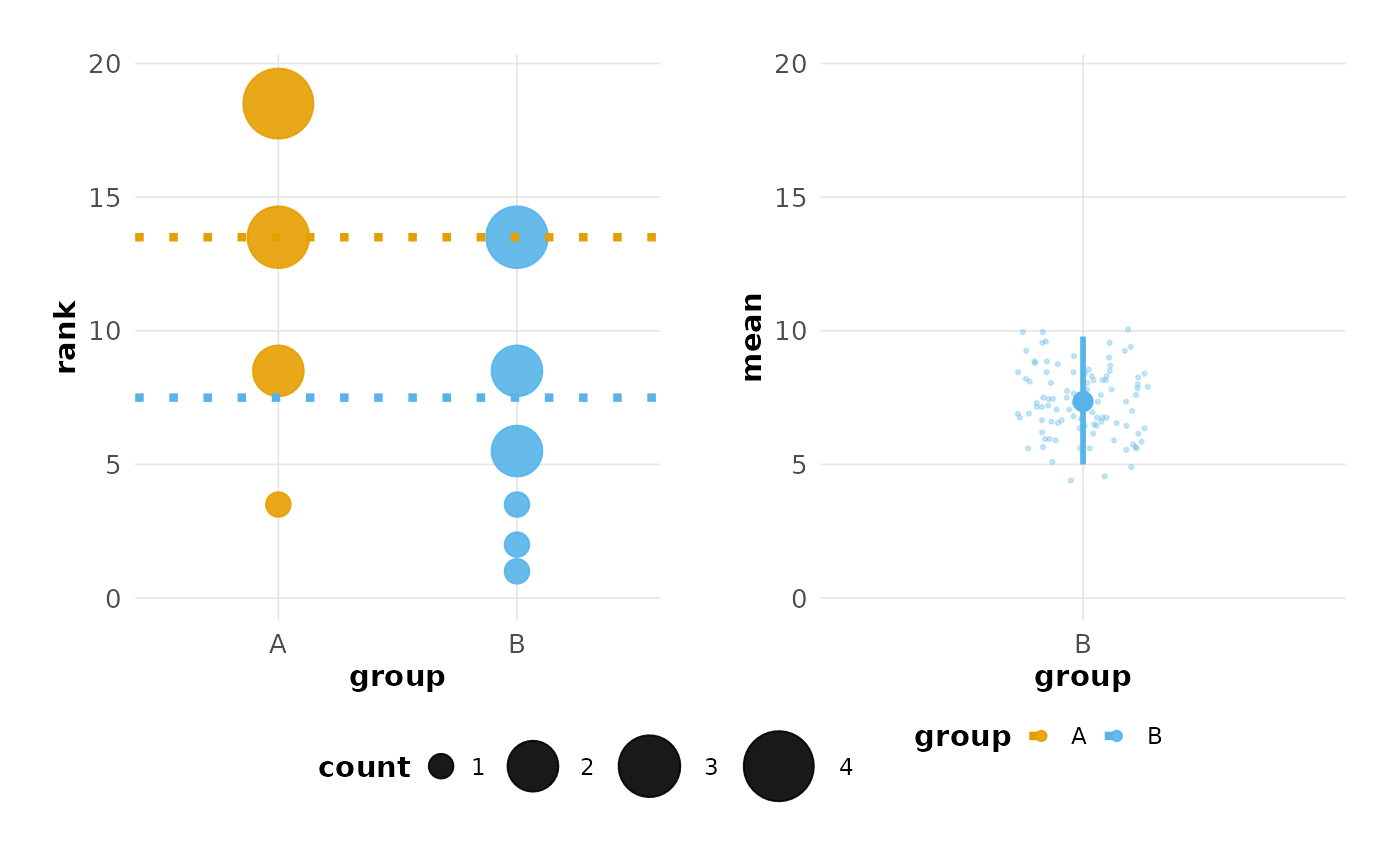
plot(hr, config = besthr_style("default"))
#> Confidence interval: 2.5% - 97.5%
# Same as default
plot(hr, config = besthr_style("default"))
#> Confidence interval: 2.5% - 97.5%